
An undocumented 10 ms grace window was the difference between 503 exclusions and the paper’s reported 489.
In a five-author ULAB replication, our team tested whether 104 listeners could identify people from paired screams. I traced 6,240 raw trials to the exact 5,543-trial analysis set and rebuilt the signal-detection pipeline in R.
Listeners achieved a mean accuracy of 0.77 and a mean d′ of 1.63, indicating reliable discrimination between vocalizers.
The Problem
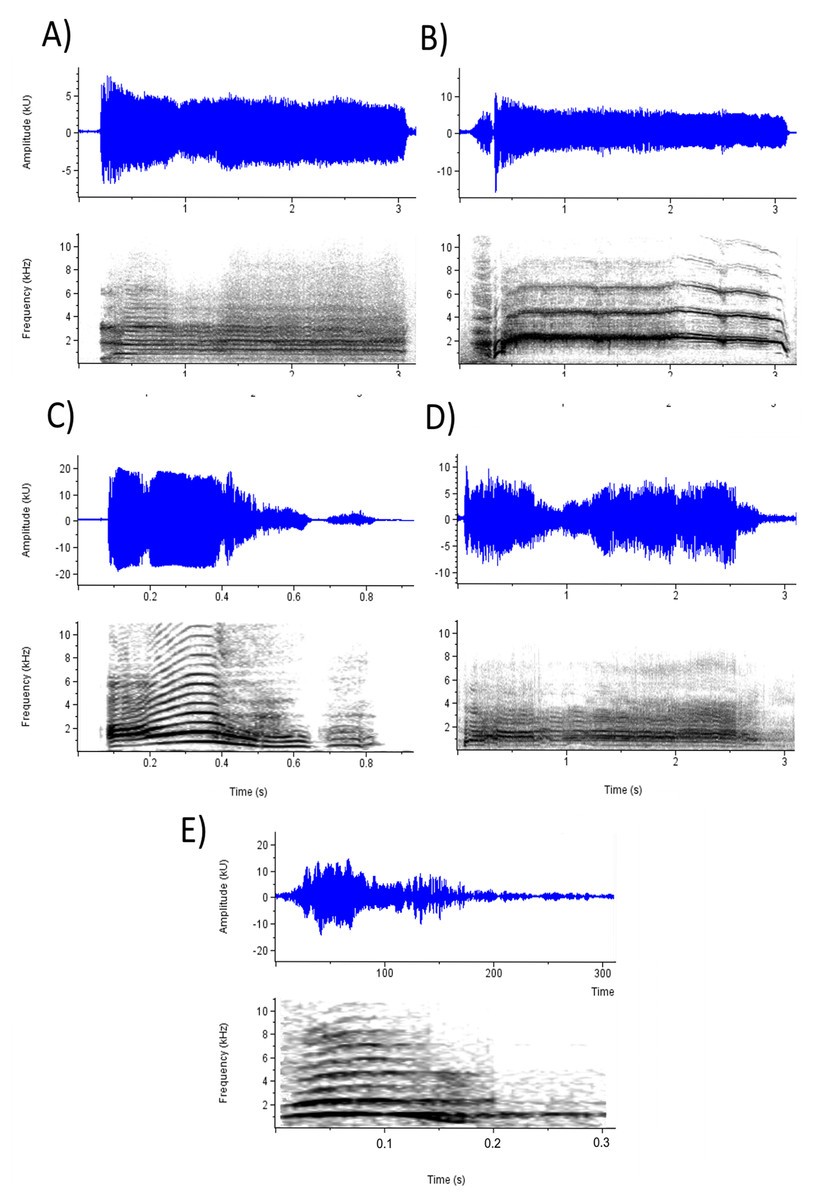
Can a listener determine whether two screams came from the same person?
That question is more difficult than a raw accuracy calculation suggests. A participant may favor “same” or “different,” making percent correct sensitive to response bias. Perfect hit rates and zero false-alarm rates also produce infinite values after the required normal-distribution transformation. Finally, each listener responded to both female and male vocalizers, so the observations could not be treated as independent.
Each participant heard 60 randomized scream pairs separated by 2000 ms of silence. The trials included same-vocalizer pairs, different-vocalizer pairs, and duration-modified pairs in which the same scream was replayed at 50% to 150% of its original length. After two duplicated pairs were removed, the study contained 58 unique stimulus pairs: 23 same-vocalizer, 23 different-vocalizer, and 12 duration-modified.
The analysis therefore required three things before hypothesis testing could begin: reconstructing the intended trial set, implementing d′ correctly, and modeling repeated observations at the participant level.
KEY CHALLENGES

Methodology
&
Insights
Approach
1. Reconstructed the intended stimulus set
The raw file contained 6,240 trials, while the published analysis began with 6,032. I compared the trial data with the supplementary audio manifest and identified two repeated stimulus pairs: DifferentVocalizer_21 and SameVocalizer_4. Removing those records reproduced the paper’s starting count exactly.
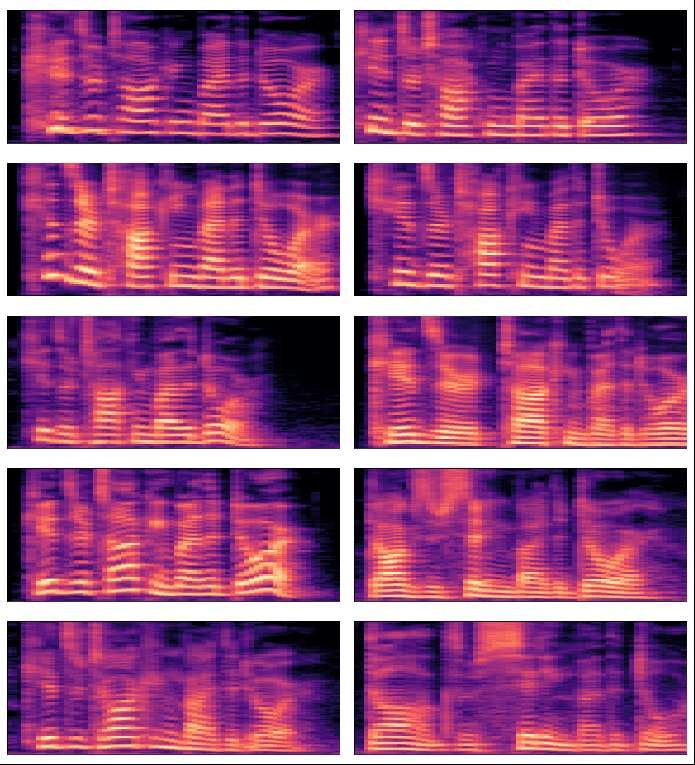
The resulting stimulus set contained 58 unique pairs drawn from 41 female and 17 male vocalizers. The recordings came from film, television, and social media, were cleaned in Adobe Audition, and were normalized to 16-bit, 22.05 kHz WAV files.
2. Reverse-engineered the premature-response exclusion
The paper stated that 489 responses occurred before the second scream finished. A direct filter using Actual_Latency < 0 excluded 503 trials, so that could not have been the original rule.
I sorted the negative latency values and inspected the observation at the reported exclusion boundary. The result revealed a 10 ms grace window. Applying Actual_Latency < -10 removed exactly 489 trials and produced a final analysis set of 5,543.
3. Calculated signal-detection sensitivity
I classified a hit as correctly responding “same” to a same-vocalizer or duration-modified pair. A false alarm occurred when a listener incorrectly responded “same” to a different-vocalizer pair.
For each participant, I calculated:
d′ = qnorm(hit rate) − qnorm(false-alarm rate)
I used qnorm() because signal-detection rates must be evaluated against the standard normal distribution. Using scale() would instead standardize values against the sample and calculate a different quantity.
Perfect hit rates and zero false-alarm rates produce positive or negative infinity under this transformation. I bounded the rates using 1/N and (N−1)/N, with N based on each participant’s available trial count, before recalculating d′.
4. Modeled the repeated-measures design
I reshaped and summarized the data with dplyr and tidyr, checked descriptive statistics with psych, and modeled d′ and response latency separately.
Vocalizer gender was the within-participant factor, while listener gender was the between-participant factor. I used nlme::lme with subject-level random effects and random slopes to account for repeated observations. I then used car::Anova with Type III sums of squares to align the R analysis with the SPSS convention used in the original study.
Figures were generated with ggplot2. The complete pipeline preserved the trial counts, exclusion logic, rate corrections, and model specification required to reproduce the analysis.
KEY FEATURES
1. Reproducible data reconciliation
I did not treat the published trial count as an unexplained discrepancy. I traced the 208-row difference to two duplicated stimuli and documented the exact exclusions needed to move from 6,240 to 6,032 trials.
2. Metric implementation from first principles
I constructed hit and false-alarm rates from trial-level responses, transformed them with qnorm(), and corrected boundary rates before computing d′. This avoided both response-bias errors and infinite values for perfect responders.
3. Model selection based on experimental structure
I treated vocalizer gender as a repeated condition within listeners and listener gender as a between-participant factor. The mixed-effects specification preserved that dependency instead of analyzing thousands of trials as independent observations.


RESULTS AND IMPACT
Listeners achieved an overall mean accuracy of 0.77 with SE = 0.01. Mean sensitivity was d′ = 1.63 with SE = 0.06, indicating that listeners could reliably distinguish whether two screams came from the same vocalizer.
Discrimination was slightly higher for male vocalizers. Male screams produced a mean d′ of 1.69 with SE = 0.07, compared with 1.55 and SE = 0.06 for female screams. The main effect of vocalizer gender was statistically significant, F(1, 102) = 4.25, p = 0.042.
Vocalizer gender also affected response latency, F(1, 102) = 12.84, p = 0.0005. Mean latencies were:
Female listener, female vocalizer: 990.68 ms, SE = 57.57
Female listener, male vocalizer: 1099.55 ms, SE = 71.79
Male listener, female vocalizer: 1183.58 ms, SE = 88.34
Male listener, male vocalizer: 1371.91 ms, SE = 110.17
Listener gender did not significantly affect d′, p = 0.715, or latency, p = 0.067. The listener-by-vocalizer interaction was also nonsignificant for d′, p = 0.565, and latency, p = 0.328.
The replication matched the original study in the direction and statistical significance of both vocalizer-gender effects. The original reported d′ values of 1.72 for male screams and 1.55 for female screams. Our male estimate was slightly lower at 1.69, most likely because the original analysis did not document whether the d′ corrections used fixed trial totals or each participant’s remaining trials after exclusion.
Limitations
The vocalizer stimuli were unbalanced, with 41 female and 17 male vocalizers. The observed gender effect is therefore partially confounded with which recordings happened to represent each group. The d′ result was also close to the significance threshold at p = 0.042 and should be treated as fragile rather than definitive.
The most transferable result was the preprocessing audit. I reproduced both published exclusion counts, recovered an undocumented threshold, and documented the remaining denominator difference instead of adjusting the analysis until every estimate matched.
View the work: