
The academic brief framed ABC Multinational Bank as a client trying to identify retail customers at risk of leaving. Across 10,000 customers with 20.4% churn, the team prioritized recall, AUC, calibration, and train-to-test stability rather than raw accuracy. Boosted C5.0 reached 0.863 test AUC and 84.7% accuracy. In a four-person Harvard Extension School graduate team, I owned the Random Forest challenger and model-governance work: class weighting, OOB and importance analysis, limitations, and monitoring. This was not a deployed bank system.

A 79.6% accuracy baseline is the trap. The 10,000-row dataset had no missing values or duplicate rows and used a stratified 70/30 split that preserved the 20.4% churn rate. Because churn was the minority class, a model could predict “retained” for everyone and look almost 80% accurate while identifying zero customers for intervention. That forced the evaluation away from accuracy alone and toward recall, precision, F1, AUC, calibration, and class-aware error tradeoffs. At a 0.50 cutoff, logistic regression caught only 21.8% of churners despite 81.2% training accuracy. A 0.35 threshold raised recall to 42.1% while accepting more false positives. The cost logic is asymmetric: missing a churner risks remaining lifetime value plus replacement acquisition cost, while a false positive mainly costs outreach and a retention offer. Without bank-specific cost data, 0.35 is a decision framework, not a financially optimized threshold.
Three Decisions That Changed the Result

Methodology
&
Insights
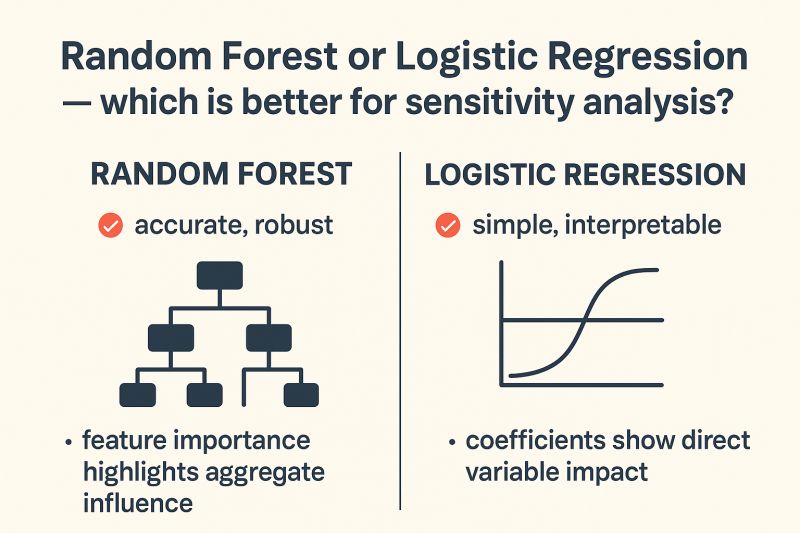
The champion decision came from held-out performance, not the largest training score. The team compared a stepwise logistic baseline, a 25-trial Boosted C5.0 model, and a 500-tree class-weighted Random Forest on the same stratified test set. C5.0 produced the highest test AUC and accuracy and the lowest Brier score. Random Forest had slightly higher recall and F1, so the choice was not automatic.
Model | AUC | Accuracy | F1 | Precision | Recall | Brier |
|---|---|---|---|---|---|---|
Logistic Regression | 0.762 | 79.5% | 0.464 | 0.497 | 0.435 | 0.138 |
Boosted C5.0 | 0.863 | 84.7% | 0.625 | 0.624 | 0.627 | 0.103 |
Random Forest | 0.859 | 84.6% | 0.630 | 0.617 | 0.643 | 0.116 |
The deciding question was which model best balanced discrimination, probability quality, and stability outside training. The 0.35 operating threshold was then carried into held-out evaluation, where C5.0 reached 62.7% churn recall.

Why My 98.2% Random Forest Lost
Random Forest nearly won on the test set, but its training behavior made the risk visible. My 500-tree challenger, using 1:4 class weights, reached 98.2% training accuracy and 0.999 training AUC. On test data, that fell to 84.6% accuracy and 0.859 AUC, roughly a 14-point accuracy collapse. C5.0 moved from 87.8% to 84.7%, only about three points, while posting a slightly higher test AUC of 0.863. Random Forest did edge C5.0 on test recall, 64.3% versus 62.7%, and F1, 0.630 versus 0.625. I would still choose C5.0 because its generalization gap was smaller and its Brier score was better, 0.103 versus 0.116. The lesson was not “tree boosting wins.” It was that near-identical test scores can hide very different risk profiles.


What I Would Fix Before Production
Before operational use, I would treat 0.863 AUC as a monitored baseline, not a permanent property. I would check AUC monthly and trigger revalidation if it drops by more than 0.03, investigate PSI at 0.20, and rebuild after PSI exceeds 0.25 for two consecutive periods. Quarterly Hosmer-Lemeshow checks would flag recalibration needs, alongside explicit model-retirement triggers. The logistic benchmark passed Hosmer-Lemeshow at p = 0.269 and kept all VIFs below 1.19, but Box-Tidwell found significant nonlinearity for age, balance, and credit score. I would test splines, transformations, or polynomial terms and revalidate coefficients. The 83% churn rate for three-product customers and 100% for four-product customers are hypotheses, not stable effects; the four-product group has only 60 customers. Finally, this cross-sectional dataset lacks behavioral time series, competitor actions, and macroeconomic context. Its relationships are predictive and correlational, not causal.
